

The history of information is the history of the products of human creativity, intelligence, and passions, and the preservation and transmission over time and space of humanity’s traditions, beliefs, and experiences. In other words, the history of teaching—the original meaning of information—and learning.
This newsletter primarily tracks the history of the large family of tools and technologies used to create, process, share, store, organize, and analyze data and information. “AI” is today’s most talked-about such tool, but its history covers only the seven-plus decades since the advent of modern computing. Maps—providing information to help organize the world around us—have been guiding humans since they started communicating, teaching, and learning.
Here are a few random cartography coordinates:
The Saint-Bélec slab was found in Finistère, France, in 1900. This 4,000-year-old stone slab is believed to be a representation of the Odet Valley and the surrounding area in early Bronze Age Brittany. It is considered the oldest cartographic representation of a known territory in Europe, possibly serving as a tool for planning hunting excursions or as an aid in storytelling.
The oldest known world map dates to 500-700 BC. It is inscribed on a clay tablet discovered in the city of Sippar in southern Iraq. Centered around Babylon, it shows the world as a disc, surrounded by a ring of water labeled as the "Bitter River.”
In 300 BC, Dicaearchus, a student of Aristotle, placed an orientation on the world map, running east and west through Gibraltar and Rhodes. His reference-line principle was developed later by others into a comprehensive system of parallels and meridians.
Around 150, Claudius Ptolemaeus (Ptolemy) produced the Geography (Greek for “guide for drawing the Earth” or “description of the Earth”), also known by its Latin names as the Geographia and the Cosmographia, a geographical dictionary, an atlas, and a treatise on cartography, compiling the geographical knowledge of the 2nd-century Roman Empire. It included a list of 8,000 places and their approximate latitudes and longitudes.
In 1270, a sea chart was shown to Louis IX, king of France, on the occasion of his participation in the Eighth Crusade. This is the earliest record of the existence of a sea chart. The earliest surviving chart, known as Carta Pisana, dates from about 1275 and was drawn on sheepskin, depicting the entire Mediterranean Sea.
On August 5, 1475, the first printed maps were published in Lübeck, Germany, in the 474-sheet Weltchronik Rudimentum novitiorum, by printer Lucas Brandis. The book was intended to serve as a textbook on the history of the world for novice monks.
In 1507, Martin Waldseemuller’s world map in Cosmographiae Introductio was the first to label the New World “America,” after the explorer Amerigo Vespucci.
The earliest known example of a map designed to portray a fictitious land described in a literary work was a woodcut map of Thomas More’s Utopia. Made by an unknown artist, the first edition was published in Louvain in 1516.
The first atlas: “Aegidius Hooftman, [an Antwerp] merchant, complained to his assistant Radermaker how cumbersome it was to have to assemble a collection of various maps and charts in order to conduct his business overseas. [Abraham] Ortelius spotted a product opportunity and began to assemble a group of maps that could all be printed and bound together in a single volume. The trick was for it to be large enough to contain plenty of useful detail, but small enough to be convenient to carry on ships or keep in an office.
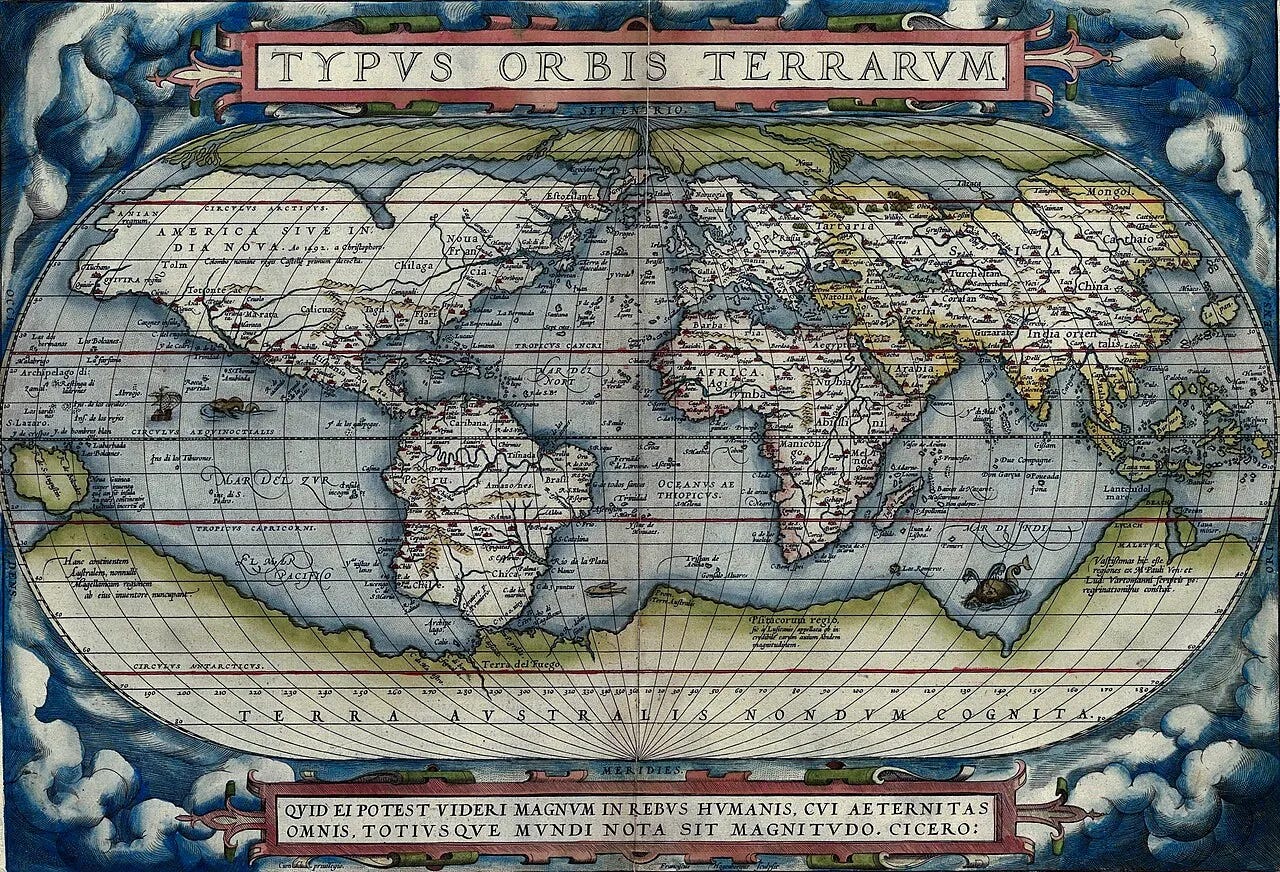
Apparently, Ortelius knew Mercator, who was older and more established, and discussed with him his idea of a book of maps. Mercator happened to be working on the exact same concept, though was magnanimous enough to encourage the younger cartographer. It took Ortelius a full decade’s worth of work, but in 1570 he was finally ready to publish his Theatrum Orbis Terrarum (Theatre of the Globe of the World). The first edition contained 53 maps, which Ortelius had compiled from the works of some 87 of Europe’s finest mapmakers…” [M.E. Rothwell in Cosmographia].
In 1748, the first systematic national topographical survey in France (and the first of its kind in Europe) culminated in the publication of the 182-sheet Carte géographique de la France. On inspection, Louis XV remarked that the more accurate data captured in the survey resulted in a “loss” of more territory than his wars of conquest had gained.
On August 18, 1966, Lunar Orbiter 1 began circling the Moon to map its surface in unprecedented detail.
Mapping the universe with “the largest map in human history”: Began in 2000, the Sloan Digital Sky Survey is the most ambitious astronomical survey project ever undertaken. The survey will map in detail one-quarter of the entire sky, determining the positions and absolute brightness of hundreds of millions of celestial objects. It will also measure the distances to more than a million galaxies and quasars.
On August 22, 2007, Google launched Google Sky, a virtual telescope and “an exciting way to browse and explore the universe.” It was discontinued by Google in 2012, but “you can continue to view the Moon, Mars, and Sky in Google Earth Pro. To view the Moon, Mars, and other planets, go to Google Maps in Space.”
From carving a rock representing their immediate physical environment to creating readily accessible online images covering the universe, humans have used maps for (at least) four millennia to imagine and document their world and their place in it.
Only three decades ago, however, the nature of what we mean by “place” and even “the world” changed. The shift from physical to virtual, from analog to digital, resulted from the invention of one man who strove to create a better way to find and link information (initially, scientific research references). His idea was to develop computer software that would assign a unique address, a virtual latitude and longitude (Uniform Resource Locator or URL), to every piece of online information, in addition to standards defining how to build the containers of information and how these containers would exchange information (HTML and HTTP).
On August 6, 1991, Tim Berners-Lee launched the world’s first website. He also posted a brief summary of his idea for the World Wide Web to the alt.hypertext Usenet newsgroup. It was the first public mention of the project.
The Web replaced an information tool invented in 1780, when Baron Gottfried Freiherr van Swieten, the prefect of the Imperial Library in Vienna, introduced the world's first card catalog. Van Swieten's innovation enabled the addition of new entries in a conveniently searchable order.
Berners-Lee wanted to liberate information organization from what he saw as the “hierarchical straight-jacket” of card catalogs and similar tools, where new entries were added to the most appropriate place in a pre-determined hierarchical map of the information landscape as it was known at a given time. Hierarchical, as in creating “ontologies,” maps for defining key subjects and navigating among their subordinate concepts and the pre-determined relationships between them.
Berners-Lee substituted the rigid classification systems previously dominating the organization of information with a flexible, associative reference scheme: “By being able to reference everything with equal ease, the web could also represent associations between things that might seem unrelated but for some reason did actually share a relationship. This is something the brain can do easily, spontaneously.”
Berners-Lee’s insight is frequently linked to Vannevar Bush’s “As We May Think,” published in 1945: “The human mind… operates by association. With one item in its grasp, it snaps instantly to the next that is suggested by the association of thoughts, in accordance with some intricate web of trails carried by the cells of the brain… Our ineptitude at getting at the record is largely caused by the artificiality of systems of indexing… Selection [i.e., information retrieval] by association, rather than by indexing may yet be mechanized.”
The earliest use of cross-references, to the best of my knowledge, was by Ephraim Chambers in his Cyclopaedia, published in London in 1728. While lacking the worldwide platform for “crowd-sourcing” references that Berners-Lee invented, Chambers shared with him (and Bush) a dislike for hierarchical, alphabetical, indexing systems. Here’s how Chambers explained in the Preface to the Cyclopaedia his innovative system of cross-references: “Former lexicographers have not attempted anything like Structure in their Works; nor seem to have been aware that a dictionary was in some measure capable of the Advantages of a continued Discourse. Accordingly, we see nothing like a Whole in what they have done…. This we endeavoured to attain, by considering the several Matters [i.e., topics] not only absolutely and independently, as to what they are in themselves; but also relatively, or as they respect each other.”
Working at CERN (the European Organization for Nuclear Research), Berners-Lee's immediate goal was to provide his colleagues (and their colleagues in other research institutions) with an online tool that would replace another very old information tool, the citation index. The earliest known citation index was an index of biblical citations in rabbinic literature, the Mafteah ha-Derashot, attributed to Maimonides and probably dating to the 12th century. In 1955, Eugene Garfield published "Citation indexes for science" in the journal Science, and in 1964, the first version of the book Science Citation Index, to “quickly locate key papers from reliable scientific journals and explore a comprehensive citation network to discover related research” (to quote the current Web-based version).
Getting acquainted with citation indexes at the Stanford University library as PhD students, Google’s founders were the first to seize on Berners-Lee’s insight and build their information retrieval business on tracking closely cross-references (i.e., links between Web pages) as they were happening and correlate relevance with quantity of cross-references (i.e., popularity of Web pages as judged by how many other pages linked to them). This set Google apart from its competitors, especially Yahoo, which at the time led the new business of producing maps for navigating the rapidly expanding online information landscape. Yahoo employed many people to organize the content of the Web into a neat taxonomy, and even had a “Chief Ontologist” on staff.
Web pages were proliferating at the time (late 1990s) due to another invention: an easy-to-use “Web Browser,” which facilitated both the viewing of online information (in all its forms—text, audio, images, and videos) and the creation of such information by anyone with access to the internet. Including creating maps, online maps. For example:
On September 8, 2007, during Rome’s all-night festival of Notte Bianca, Wiki City Rome was launched. Using data from cell phones and other wireless technologies, it maps the city’s pulse in real-time. Anyone with an internet connection could view the movement of crowds, event locations, the whereabouts of well-known Roman personalities, and the real-time positions of city buses and trains.
The nonprofit Reinvestment Fund launched PolicyMap.com in May 2008, a website that allows users to access neighborhood-specific demographic information and create custom maps comparing selected areas on variables ranging into the hundreds, including mortgage types, political contributions, occupations, home values, crime, race, incomes, and education levels.
Epidemiologist John Brownstein, along with computer scientist Clark Freifeld, created HealthMap in 2008, which tracks disease in real-time. Scraping news aggregators such as Google News and global electronic infectious and toxin reporting systems, HealthMap matches infectious disease terms with words related to geography. Results are superimposed over Google satellite maps.
“[Mobile phone location log data] may lead to a new kind of cartography. Maps will identify places not by their roads, forests, or mountain ranges, but by what kinds of people spend time there and by what they do.” —BusinessWeek, February 26, 2009. “One of the themes of my profession right now is the democratization of cartography. Mapping used to be a job of the elite …. Now people are taking it upon themselves to map their passions.” —Mark Harrower, Professor of Geography, University of Wisconsin-Madison.
Now communicating their virtual coordinates and pursuits, humans continue to create and use maps to organize their world and their place in it. The online world Berners-Lee and followers created has allowed us to benefit from what Chambers called the “Advantages of a continued Discourse,” the constant updating of information, now placed at our fingertips and always accessible.
The invention of a virtual map of information, however, has transformed into a new world, a new reality for humans to inhabit, for better and for worse. It broke time and space barriers, facilitating improved connections, human and otherwise, but also highlighted the disadvantages of the continuing discourse and enabled the proliferation of useless, inaccurate, and misleading information (now supercharged by “AI”).
Information tools are as good or as bad as the humans creating and using them.